Seven Years of Japan’s National Cost-Effectiveness Assessments – What Have We Learned?

Following the introduction of Japan’s formal cost-effectiveness assessment (CEA) framework in 2019, Heather Wellam (Senior Consultant – Market Access, Petauri Evidence) reflects on the trends emerging from the early Center for Outcomes Research and Economic Evaluation for Health (C2H)-led assessments and what they reveal about the real‑world impact of Japan’s re-pricing system. This analysis draws on published data available up to the end of 2023, with 2024–2025 assessments not yet published and still being reviewed by C2H, providing an early view of how the system is evolving in practice.
This builds on our original 2022 review, ‘Implementation of Cost‑Effectiveness Analyses in Japan’s Health Technology Assessment Process’, which outlined the foundations of Japan’s modernised health technology assessment (HTA) framework.
Cost-Effectiveness Assessment Volumes in Japan: A Slow and Steady HTA Pipeline
When Japan introduced formal cost‑effectiveness evaluation in 2019, policy-makers were clear that capacity would be limited. The system was intentionally designed to assess only a subset of products due to a shortage of health economic experts and the need to avoid overloading the system.
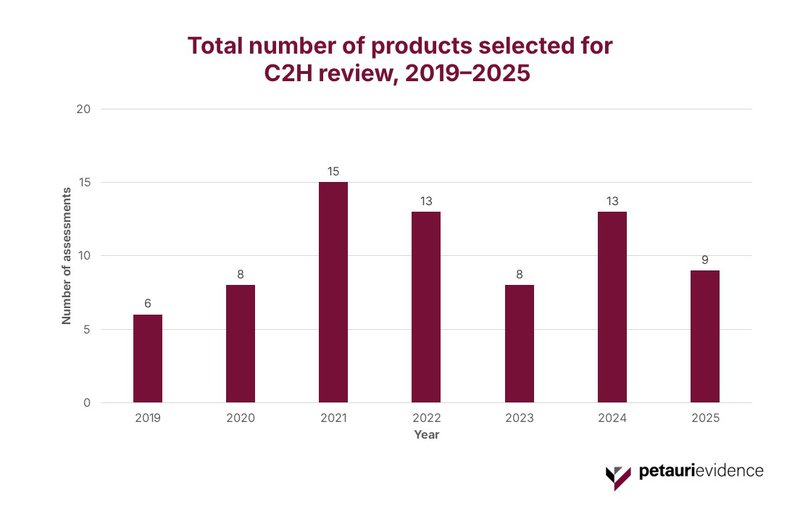
Importantly, no formal target for annual throughput was ever published, with government documents emphasizing that only a small number of high‑impact products could realistically be evaluated. Five years on, the actual throughput appears broadly consistent with those expectations. As shown in Figure 1, selected products show a pipeline averaging 10 assessments per year (range: 6 to 15), reflecting a deliberately selective, low‑volume model that does not aim for comprehensive coverage.
Chuikyo’s Assessment Selection Criteria: A System Designed to Prioritise High-Impact Products
The Central Social Insurance Medical Council (Chuikyo) applies a five‑tier selection framework (H1–H5) to determine which products are routed into assessment by C2H. This selection framework is driven primarily by forecasted or actual sales. The first seven years of published data show this framework operating as intended.
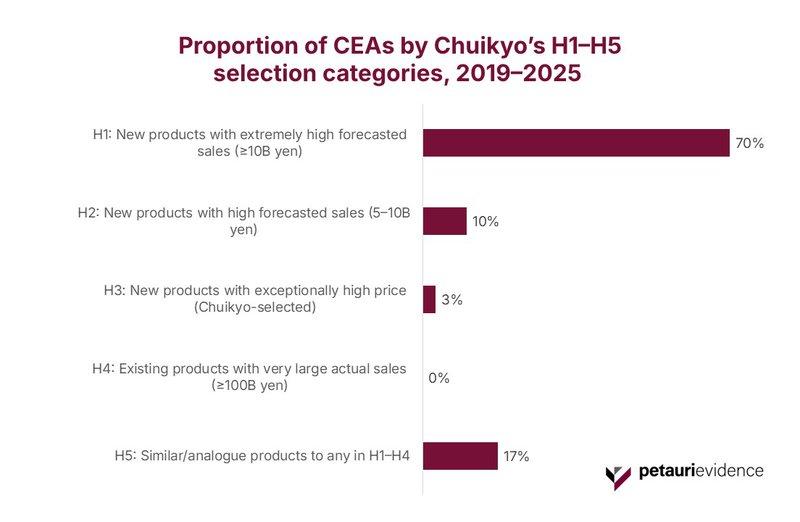
As shown in Figure 2, H1 products (new launches with extremely high forecasted sales [≥10 billion JPY]) account for 70% of all assessments. This reflects the system’s strong emphasis on products expected to exert significant budgetary impact. H2 products, which also carry substantial (but slightly lower) forecast sales, represent a further 10% of cases.
Only 3% of assessments fall into H3 (a category reserved for exceptionally high‑priced technologies), selectively flagged by Chuikyo even when sales forecasts alone would not place them into H1 or H2.
Notably, no H4 products (older medicines with very large actual sales) were selected during this period, confirming that the framework is not typically used for retrospective reassessment of established high‑volume therapies. Meanwhile, H5 analogue products, which are linked to items in H1–H4, account for 17% of assessments, reflecting the system’s use of comparator alignment where relevant.
Taken together, the distribution illustrates a selection mechanism that is highly targeted, forward‑looking, and focused on new, high‑impact launches, rather than pursuing broad retrospective reassessments across the market.
Price Adjustment Analysis in Japan: A System Applying Increasing Downward Pressure
Following C2H’s economic evaluation, Chuikyo applies a post‑assessment price adjustment, which can result in price reductions, maintenance, or, in rare cases, increases.
In the analysis below, we focus on the first five years of published C2H decisions (2019–2023). Assessments for 2024 and 2025 are still in progress and not yet published, so these have not been included in the evidence base. Even within this initial dataset, the re-pricing mechanism is clearly active and directionally consistent with Japan’s policy objective of improving value for money while maintaining access.
Negative Price Adjustments are the Norm
Across the dataset, most assessed products received a downward price adjustment, consistent with the intended function of the system. Figure 3 shows a tightly clustered pattern of mid single‑digit reductions, with a median of −3.8% and a mean of −4.4%. One extreme outlier (−24%) was removed. Products without a published price revision were also excluded from the data.
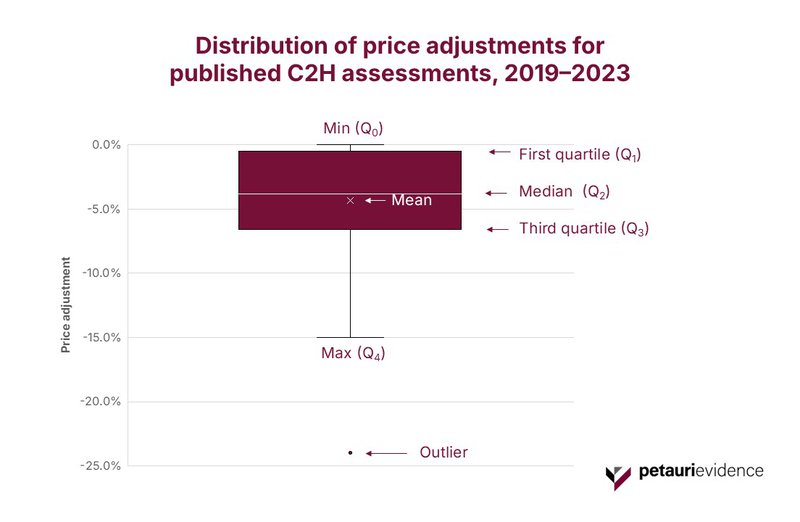
The whiskers span 0–15%, indicating that while the system can apply deeper cuts, most adjustments fall within a relatively narrow band.
This concentration suggests a stable and predictable downward‑pressure regime, where most high‑impact products experience modest but meaningful re-pricing once economic evidence is reviewed.
Higher ICER Intervals Correlate with Steeper Price Reductions
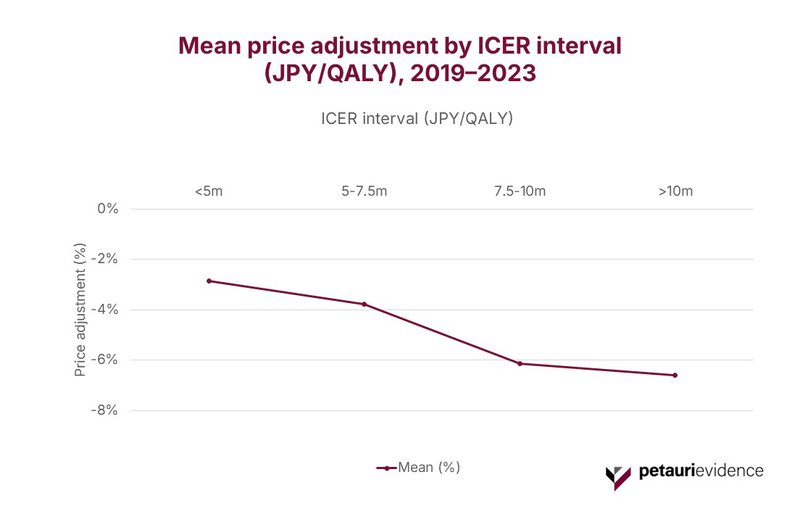
The magnitude of adjustment also varies systematically by incremental cost-effectiveness ratio (ICER). As shown in Figure 4, there is a stepped relationship between ICER intervals and the magnitude of Japan’s price adjustments. Mean reductions deepen from −3% (<5 million JPY/quality-adjusted life year [QALY]) to −4% (5–7.5 million), −6% (7.5–10 million), and −7% for products exceeding 10 million JPY/QALY.
This gradient reflects the structured four‑band adjustment framework embedded within Japan’s CEA system and illustrates that the higher the ICER, the stronger the downward price pressure.
Importantly, this pattern is not just descriptive – it signals where pricing risk concentrates. Products landing in the upper ICER bands are disproportionately advanced biologics, oncology therapies, and gene‑based or precision medicines. As such, the very products driving therapeutic innovation are also those most exposed to Japan’s most significant post‑launch re-pricing.
For manufacturers, this reinforces the need for early scenario modelling, careful justification of value drivers, and proactive evidence planning to mitigate the likelihood, or severity, of steep adjustments.
Key Takeaways for Companies Planning to Launch in Japan
Expect selective but meaningful scrutiny
Only a small number of products enter formal CEA each year, but those selected typically face detailed economic review and the potential for material price adjustments.
High‑impact launches carry the highest risk
Products with large forecast sales or high upfront costs, especially novel biologics, oncology agents, and advanced therapies, are consistently prioritized for assessment.
Economic evidence matters
With price reductions tightly linked to ICER intervals, early investment in robust modelling, scenario analyses, and clear value messaging can significantly influence outcomes.
Prepare early, even if selection feels unlikely
Low assessment volumes should not be interpreted as low probability. Chuikyo can still prioritize products unexpectedly when budget impact is high or precedent‑setting issues arise.
Plan for Japan‑specific requirements
Expectations around comparators, data sources, and modelling assumptions can differ from other markets; early alignment helps avoid unfavorable adjustments later.
Scrutiny is concentrated, not diluted
A narrow pipeline does not mean lighter touch; if anything, it means the system has the capacity to examine selected products in depth.
While these considerations are most directly relevant for companies preparing to launch in Japan, they also signal broader shifts that extend beyond the domestic market. As Japan’s re-pricing system becomes more structured and predictable, its influence increasingly extends beyond national boundaries, shaping how manufacturers think about launch sequencing, evidence generation, and risk exposure across highly referenced markets.
These themes are explored further in our ISPOR 2026 abstract, From Tokyo to Washington: Impact of Japan’s HTA Environment on U.S. MFN Pricing and Launch Strategy, which examines how Japan’s administrative price-reduction mechanisms intersect with emerging US models such as CMS GENEROUS. The abstract is published here, and will be presented in Philadelphia in May 2026.
Building on that foundation, we will also publish a follow-on article that looks more broadly at how Japan fits into global launch planning, and how its evolving price environment interacts with other countries’ pricing models to shape international market access strategy.
Petauri Evidence can help manufacturers navigate these challenges by supporting early evidence planning and Japan‑specific pricing and market access strategy. If you are exploring market access, evidence, and launch strategies for Japan, get in touch today via evidence@petauri.com.
Share